Build interactive calculators and embed them on your website in just a few clicks.
14-day Free Trial • No Credit Card Required
From basic calculations to complex formulas, create interactive calculators that boost engagement and generate leads.
Build complex formulas with our intuitive visual formula builder.
Create calculators without writing a single line of code.
Support for complex mathematical operations and functions.
Import datasets and reference external data in your calculations.
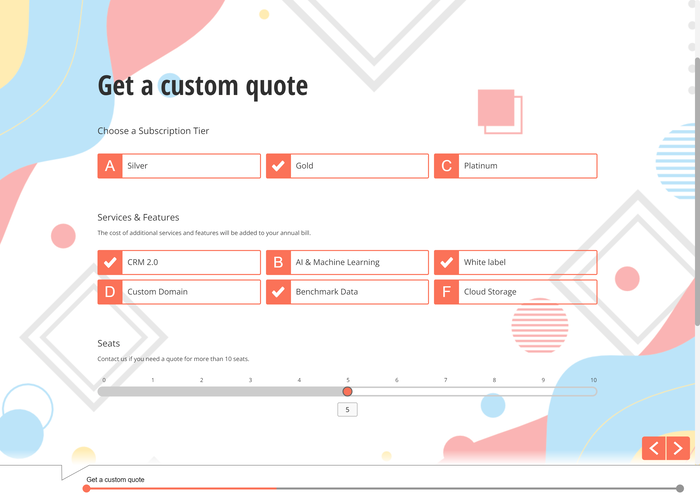
Sliders, dropdowns, text fields, and numeric inputs.
Display results with charts, graphs, and visual elements.
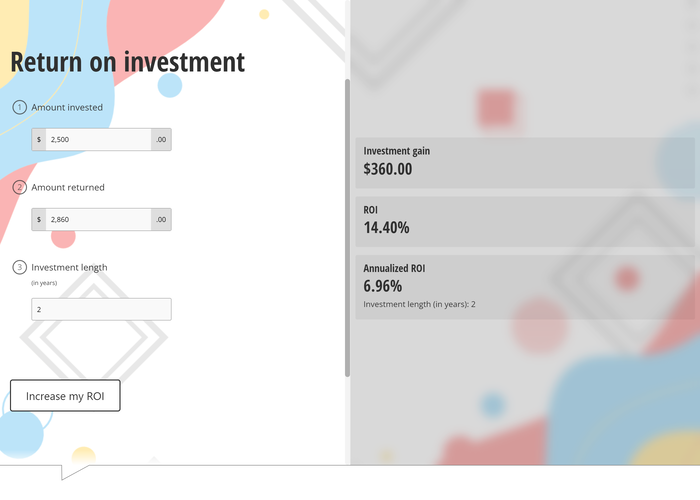
Mortgage, loan, ROI, and other financial calculators.
Calculate marketing metrics and return on investment.
BMI, calorie, and other health-related calculators.
Property value, mortgage, and real estate calculators.
Technical calculations for engineering and scientific use.
Car loan, fuel efficiency, and automotive calculators.
Capture leads through calculator interactions and results.
Calculators work perfectly on all devices and screen sizes.
Customize colors, fonts, and add your logo for brand consistency.
Easily embed calculators on your website with simple code.
Track calculator usage and user interactions with detailed analytics.
Allow users to download or email calculation results.
All calculations are secure with data privacy protection.
Calculations update instantly as users change inputs.


With Shout, you can do more than create surveys. Perform assessments, capture leads, and manage experiences. All with your compliance in mind.
Create surveys for CX, PX, & EX research with 12+ question types including NPS, multiple choice, and matrix questions.
Build engaging quizzes with automatic scoring, conditional logic, and detailed analytics. Perfect for education and lead generation.
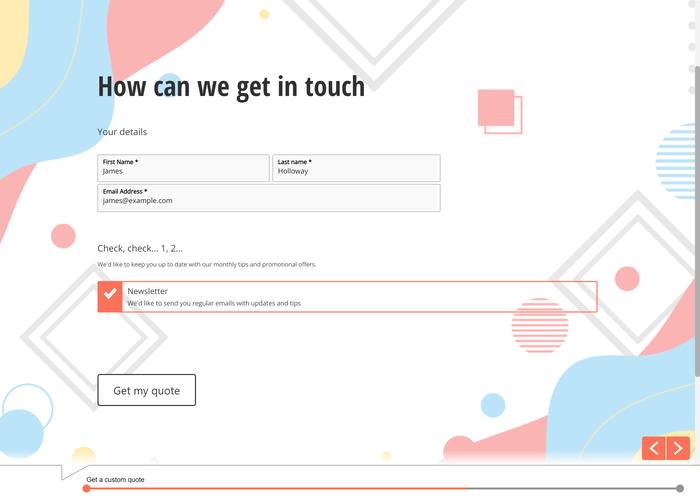
Generate leads with powerful forms that capture contacts and collect data with built-in validation and GDPR compliance.
Built from the ground up with privacy and compliance in mind. Track lawful basis for processing and record consent automatically.
Import contacts, send email invitations, and track data with our fully integrated CRM system. No additional costs.
Share surveys with team members, collaborate on reports, and maintain separate dashboards with role-based access control.
Create simple and complex calculators without writing a single line of code.
Our calculator builder lets you create simple and complex calculators without writing a single line of code. Focus on your ideas, not on syntax.
Our user-friendly builder allows you to design intricate formulas quickly. Just select your questions, choose your operators, and calculate your results.
Create more complex calculators by switching to our Excel-style spreadsheets, where you can import and reference datasets to build formulas.
From basic calculations to complex formulas, Shout has everything you need to create a custom calculator for your website.
Mortgage calculators, loan calculators, ROI calculators, and investment tools.
Lead value calculators, CAC calculators, marketing ROI, and conversion tools.
BMI calculators, calorie calculators, fitness tracking, and health assessments.
Property value calculators, mortgage estimators, and rental yield calculators.
Technical calculations, unit converters, and engineering formulas.
Car loan calculators, fuel efficiency, and vehicle cost estimators.
Interactive calculators are powerful lead magnets that provide immediate value to your visitors.
Require email addresses to reveal calculation results and build your prospect database with engaged leads.
Interactive calculators keep visitors on your site longer and provide immediate value that builds trust.
Use calculators as content marketing tools to attract visitors and guide them to your service pages.
Show calculation results in real-time with customizable displays and export options.
Results update instantly as users change inputs, providing immediate feedback and engagement.
Present results with charts, graphs, and formatted displays that are easy to understand.
Allow users to download PDF reports or email results for future reference.
No coding required! Our visual builder lets you create complex calculations using a simple formula interface. Just define your inputs, set up your formulas, and customize the results display.
Yes, calculators can be embedded on any website using our embed code. They're fully responsive and will look great on desktop, tablet, and mobile devices.
Calculators are highly engaging interactive content. You can require users to enter their email to see results, or include a call-to-action with their personalized output. They typically convert better than static content.
You can build ROI calculators, pricing calculators, savings calculators, assessment tools, quote generators, and more. If it involves calculations and user inputs, you can build it.
Absolutely. Customize colors, fonts, and layout to match your brand. Add your logo, adjust spacing, and create a seamless experience that fits your website perfectly.
Join thousands of businesses using Shout to generate leads and engage customers with interactive calculators.